

.jpg)


CRE & the Quest for the Rosetta Stone: The All-in-One 3D Data Platform
The Race to 'Go 3D' is On! It seems like every building owner, corporate real estate director or smart campus operator I meet these days is trying to develop a 3D data platform strategy to consolidate all of their building and project data portfolio-wide, but they just don’t know how to get there.
Has this not been the Quest for the Holy Grail for many years? Wouldn’t it be amazing if it were all just there at your fingertips: all your project data for all of your buildings everywhere – facilities, energy, and security data, along with all the project data, BIM, CAD, IoT, legal, leasing, financial, you name it – uniquely visualized in an easy-to-use 3D Google Earth-like tool so any user could easily search for and understand any aspect?
The Challenge: Too Many Tools, Too Many Data Formats, and Too Little Actionable Intelligence for the Portfolio
The benefits of aggregating, visualizing, and analyzing large amounts of Big Data are now well understood in the real estate industry, impacting functions that range from building management, to tenant services, to market analysis. Owners specifically acknowledge that Big Data analyzed correctly leads to increased transparency in the markets, risk mitigation, data standardization across real estate assets, and general better decision making. The challenge is that the increase in data sources and volumes has given rise to a dramatic increase in new proprietary expert tools and new data formats at the same time. These range from 3D data – or spatial data (BIM models, BMS/IoT sensors) – to non-spatial data (spreadsheets, reports, CAD dwgs, GIS, Social Media). Put simply, today’s challenge for Building Owners isn’t just to aggregate data, but to aggregate spatial and non-spatial data, and to do that they need a robust 3D data platform.
The Solution
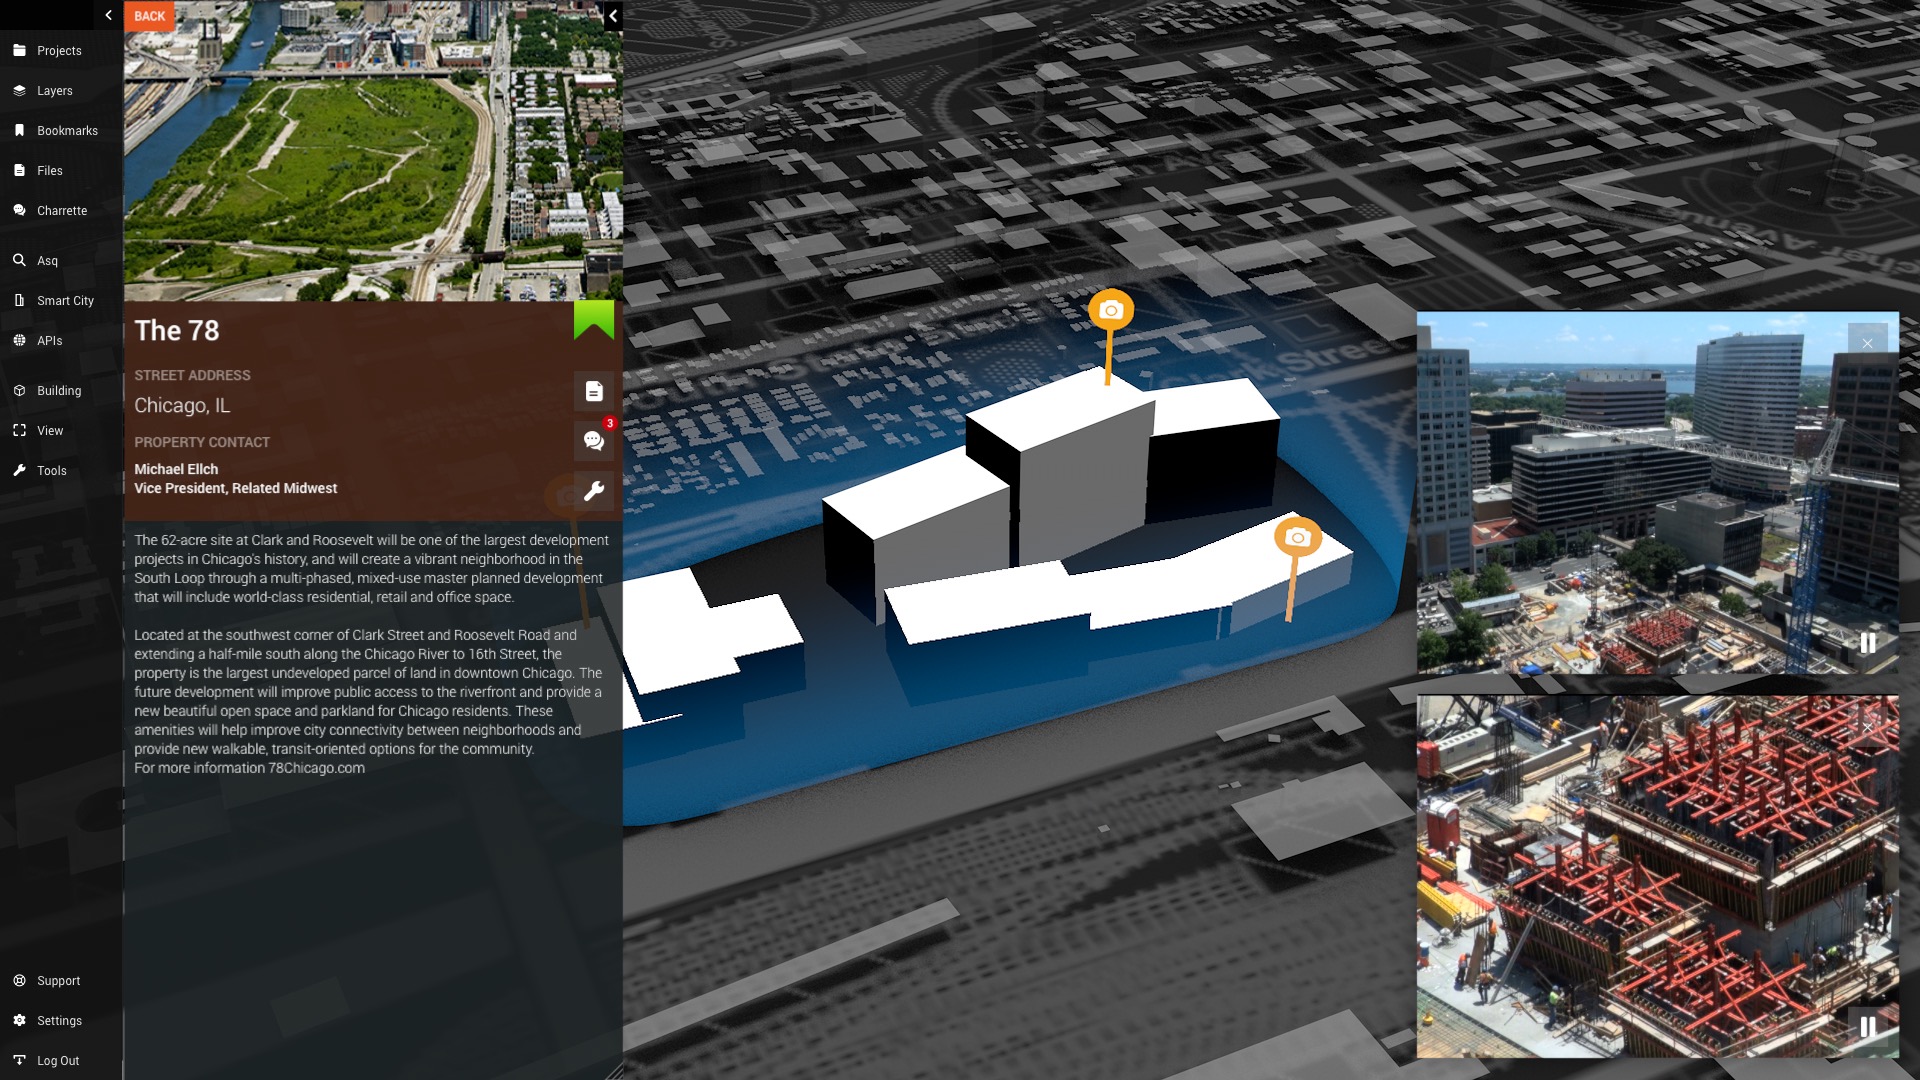
At Cityzenith, we’ve been developing the Smart World Pro platform to help owners break the Great Data Barrier in the building industry today that has kept them in the dark for so long. We are actively working with industry leaders and other institutions to develop a common 3D ‘BIM-lite’’ or FIM (i.e., Facilities Information Model) approach that enables them to digitize all their building assets to one common 3D earth model standard, and then connect any type of live or historical data to those models, all in real-time. FIM models differ from BIM models, and are simpler in geometry (rooms, floors, major equipment/structure, skin) but more complex on the data backend, ingesting data from hundreds of file formats. Features inside Smart World allows users to import and curate any data set of their own; ask questions and run complex searches; and run various analyses that range from line-of-sight and shadow studies to advanced environmental and traffic impact simulations.

What Kind of Data Can Be Visualized and Analyzed?
Users can aggregate and import hundreds of file formats, and then curate and index those files to suit their individual needs. They can navigate to any piece of information anywhere in an instant, see the results of analysis, and share the outcomes with peers. Owners are looking for better answers to questions like these:
OPERATIONS
“Which tenants in our buildings inside this 20-block area have fallen short of their predictive consumption usage patterns by more than 5% over the last seven days?”

PROJECTS
“Are my tenants happy with the new lobby that we just opened? Let’s geo-group tweets around the property to check sentiment analysis from the last month.”

What Is the End Value to Owners?
- More accurate forecasts and predictions
- Operational transparency
- Identifying unknown potential across the portfolio
- Faster and more comprehensive analysis
- Faster reactions by management
- Improved Customer Service
- More targeted leasing and sales efforts
Not a lot. And don’t worry if you don’t have BIM models of every building in your portfolio—almost no one does. It is easy and cost effective to create 3D models of existing assets from CAD, BIM, paper, LIDAR, and other building documentation, and ancillary data loading services are also available.

|
Michael Jansen, CEO, Cityzenith
An impassioned architect, urbanist, and entrepreneur, Michael has founded and led high-growth companies in the US and Asia for more than two decades. In 2004, Michael founded a major BIM services company in India backed by Sequoia Capital which grew to over 500 employees in just 4 years. In 2010, Michael assumed the helm at Cityzenith as CEO and embarked on his personal mission to transform life in cities around the globe. |
This Week’s Sponsor
At Connexxion®, we are industry leaders in providing intelligent data management and data visualization solutions to customers – from consumers and small businesses to large global enterprises. Our expertise is in helping secure, manage and visualize operational data. We developed the Connexxion® data management and data visualization platform to streamline and secure the integration of disparate data sources. Connexxion® transforms the ingested real-time data into actionable information and provides to our customers the ability to analyze and dynamically visualize their data and share their data with other solutions or applications.
Read Next
 6/13/2024
Putting the Power of AI to Work for CRE The business case for AI in commercial real estate is coming into clear focus. When combined with deep operational data,
 6/7/2024
Economic Occupancy: Measure the Effectiveness of Your Real Estate Investments Economic occupancy is a crucial metric for measuring how effectively you manage and invest in real estate
 5/23/2024
26th Annual Realcomm | IBcon Digie Award Finalists Announced! Realcomm has been presenting the Digie (short for Commercial Real Estate Digital Innovation) Awards since 1999...
 5/23/2024
The Unrealized Value of Smart Building Systems Building owners have invested in smart buildings based on the promise that bringing diverse building systems together for data sharing and management will reduce operational costs and make assets more attractive to tenants.